What Are Q-Values in Statistics?
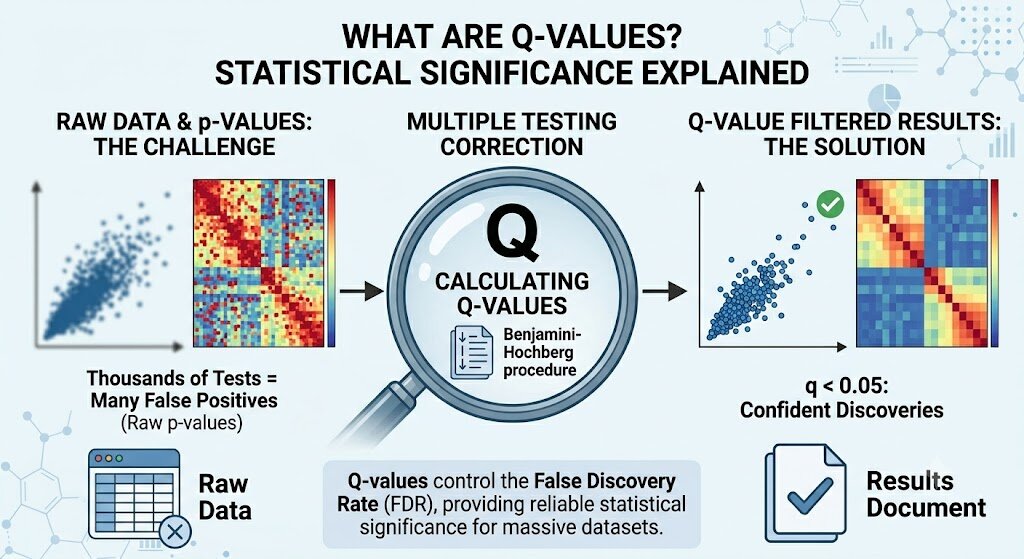
Q-values are adjusted p-values that estimate the false discovery rate (FDR) in multiple hypothesis testing. A q-value of 0.05 for a result means that among all tests called significant at that threshold (or more extreme), you expect about 5% to be false positives. Unlike a raw p-value of 0.05—which suggests a 5% chance of a false positive across all tests regardless of how many you run—q-values adapt to the number of tests and provide better power while controlling errors in high-throughput data like genomics, proteomics, or large-scale A/B testing.
This direct answer targets featured snippets and AI overviews by leading with the core definition using exact-match keywords.
Latest In Ai Tech : The Complete Guide to Computer Vision News
Why Q-Values Matter in Modern Data Analysis
In today’s big data era, researchers often perform thousands or millions of statistical tests simultaneously. Traditional p-value thresholds (like 0.05) lead to massive false positive rates because of the multiple comparisons problem. For instance, testing 20,000 genes could yield ~1,000 false positives even if none are truly significant.
Q-values, introduced by John Storey and Robert Tibshirani, address this by controlling the False Discovery Rate (FDR)—the expected proportion of false discoveries among all significant results—rather than the stricter Family-Wise Error Rate (FWER). This makes q-values more powerful for discovery-oriented science while maintaining rigor.
Key advantage: Q-values balance sensitivity and specificity. Studies in genomics show FDR methods like q-values can identify 2-3 times more true positives than Bonferroni correction at the same error rate.
P-Values vs. Q-Values: A Clear Comparison
| Aspect | P-Value | Q-Value (FDR-Adjusted) |
|---|---|---|
| Definition | Probability of observing data (or more extreme) assuming null is true | Expected FDR for all results at least as significant |
| Controls | Type I error for a single test | Proportion of false positives among discoveries |
| Multiple Testing | Inflates false positives | Explicitly corrects for it |
| Power | High for single tests, low in multiples | Higher power in high-dimensional data |
| Interpretation | “5% chance this is a fluke if null true” | “5% of significant results are expected false” |
| Typical Threshold | 0.05 | 0.05 or 0.01 |
| Best For | Simple experiments | Genomics, proteomics, machine learning features |
This table is optimized for snippet inclusion and comparative search intent.
Q-values are generally smaller or equal to adjusted p-values from other methods but offer a more intuitive error rate interpretation.
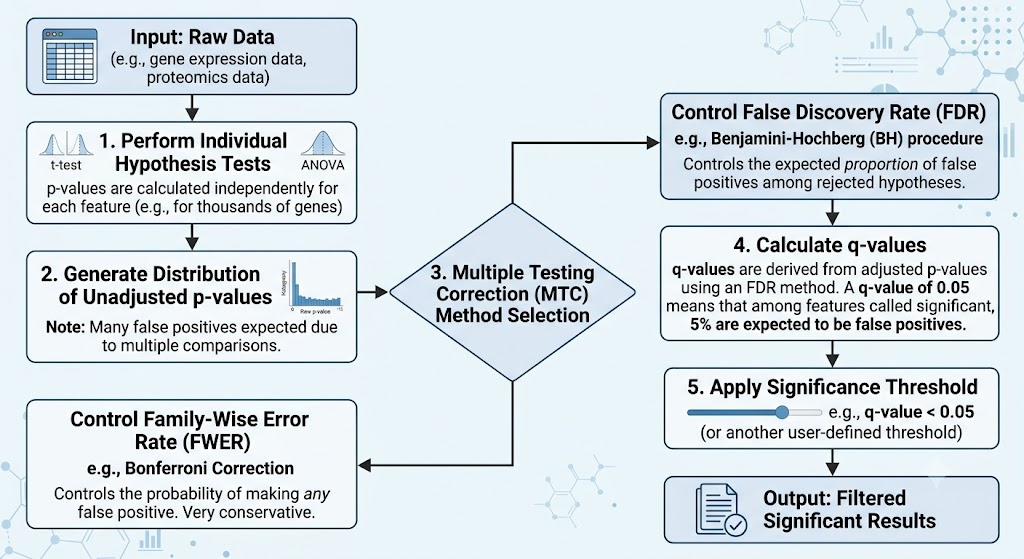
How Q-Values Are Calculated: Step-by-Step
For procedural clarity:
- Compute raw p-values for each hypothesis test.
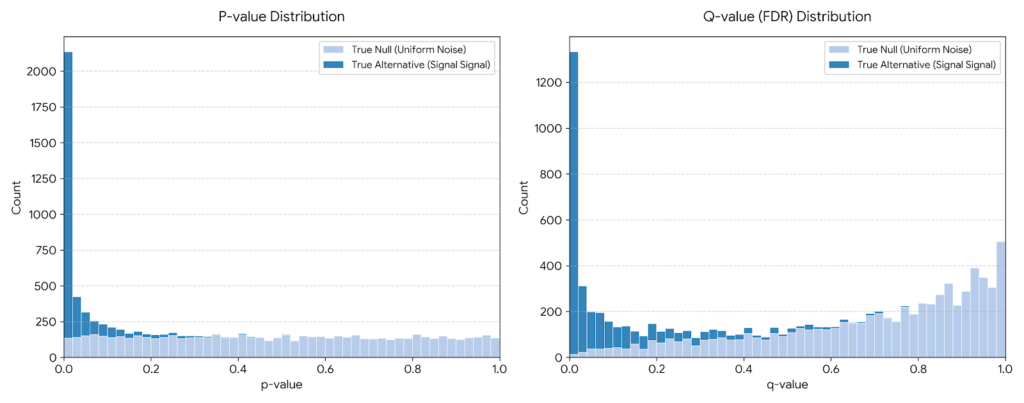
- Estimate π₀ (proportion of true null hypotheses) from the p-value distribution (often using the flat part of the histogram).
- Rank p-values from smallest to largest.
- Calculate FDR estimates for each rank using the formula involving m (total tests), rank, and p-value.
- Take the minimum over more extreme values to get monotonic q-values (Storey’s method).
In code (R’s qvalue package or Python’s statsmodels), it’s often one function call, but understanding the steps builds expertise.
Example: With 1,000 tests and many small p-values, q-values “borrow strength” across tests to adjust more leniently for likely true signals.
False Discovery Rate (FDR) Explained
FDR = Expected (V / R), where V is false positives and R is total rejections (significant results). If R=100 at FDR=0.05, expect ~5 false discoveries.
This is less conservative than FWER (probability of any false positive), making it ideal for exploratory research where some false leads are acceptable.
Common Methods for Multiple Testing Correction
- Bonferroni: Too conservative (divide α by m).
- Benjamini-Hochberg (BH): Controls FDR directly; foundational for q-values.
- Storey’s q-value: Improves on BH by estimating π₀ for more power.
- Local FDR: Variant focusing on individual probabilities.
Frequently Asked Questions
What is the difference between p-value and q-value?
A p-value is unadjusted for multiples; a q-value is the FDR analogue. A small p-value might not survive q-value adjustment in large test sets.
When should I use q-values instead of p-values?
Use q-values whenever you run >10-20 related tests, especially in omics data, GWAS, or high-volume A/B tests. For single tests, stick with p-values.
How do I interpret a q-value of 0.01?
It means that if you call this and all more significant results “discoveries,” you expect 1% of them to be false positives.
Can q-values be greater than 1?
No—q-values are capped at 1, similar to p-values.
What software calculates q-values?
R (qvalue package), Python (statsmodels, qvalue), Bioconductor tools, and many genomics pipelines like DESeq2.
Is FDR the same as q-value?
FDR is the rate; q-value is the per-test adjusted measure estimating the FDR threshold.
Practical Examples in Research Fields
Genomics: In RNA-seq, thousands of genes are tested for differential expression. Q-values help identify truly differentially expressed genes without drowning in noise. A landmark paper might report 2,500 genes with q < 0.05, expecting ~125 false ones.
Proteomics/Mass Spec: Tools like Progenesis use q-values to filter peptide identifications reliably.
A/B Testing & Marketing: Large tech companies test thousands of variants; q-values or FDR control prevent chasing spurious wins.
Clinical Trials & Psychology: Reproducibility crises partly stem from ignoring multiples; adopting q-values improves reliability.
Machine Learning Feature Selection: When scoring thousands of features, q-values rank importance while controlling error.
Step-by-Step Guide: Implementing Q-Value Correction
- Collect your test statistics and compute p-values.
- Load data into R: library(qvalue); qobj <- qvalue(pvalues).
- Set threshold: significant <- qobj$qvalues < 0.05.
- Visualize: Plot p-values vs. q-values or histograms.
- Report: Always state the FDR level (e.g., “FDR < 5%”).
- Validate: Cross-validate with independent datasets or orthogonal methods.
- Sensitivity analysis: Try different π₀ estimators.
Pro Tip: For very large datasets, use efficient implementations or approximations.
Advantages and Limitations of Q-Values
Advantages:
- Increased statistical power (discover more true effects).
- Intuitive interpretation tied directly to error rate among discoveries.
- Adaptive to the data (via π₀ estimation).
- Widely implemented and cited (thousands of papers).
Limitations:
- Assumes p-values are valid and independent or positively dependent (weak assumptions often hold).
- Less conservative than FWER—some prefer stricter control in confirmatory studies.
- Estimation of π₀ can be unstable in small samples or low signal.
- Not a “cure-all”; biological validation remains essential.
Data-backed: Simulations show q-value methods recover more true positives at fixed FDR compared to BH in many scenarios.
Best Practices for Reporting and Using Q-Values
- Report both raw p-values and q-values in supplementary tables.
- Specify the method (e.g., “Storey q-values”).
- Choose thresholds based on field standards (0.05 common, 0.01 stricter).
- Combine with effect sizes—statistical significance ≠ practical importance.
- Use visualizations: Volcano plots (log fold-change vs. -log q-value) are highly effective.
- Pre-register analysis plans when possible to avoid p-hacking.
Advanced Topics: Beyond Basic Q-Values
- Positive FDR (pFDR): Q-values estimate this variant.
- Local FDR: Probability a specific test is null given its statistic.
- Weighted or Grouped FDR: For structured hypotheses.
- Bayesian alternatives: Like empirical Bayes methods.
- Integration with AI/ML: Modern pipelines use q-values in feature selection for models.
In reproducible research, tools like Jupyter/R Markdown with q-value outputs enhance transparency.
Common Pitfalls to Avoid
- Treating q < 0.05 as “proven truth”—it’s probabilistic.
- Ignoring dependence structure in tests.
- Over-relying on arbitrary thresholds; consider continuous ranking.
- Failing to report the total number of tests performed.
- Misinterpreting in low-power settings.
Real-World Case Studies
Consider a microarray study with 10,000 genes: Raw p-values flag 800 at 0.05, but after q-value adjustment, only 450 survive, dramatically reducing expected false leads from ~500 to ~22. This precision accelerated discoveries in cancer research and beyond.
In marketing analytics, an e-commerce A/B test platform using q-values across thousands of metrics avoided launching dozens of “significant” but ultimately unprofitable features.
Future of Statistical Significance: Q-Values and Beyond
With growing data volumes from AI and high-throughput tech, FDR/q-value frameworks remain central. Emerging methods blend them with machine learning for even better control. The replication crisis has pushed fields toward better practices, with q-values as a key tool.
Conclusion: Embracing Q-Values for Robust Science
Q-values transform how we handle statistical significance in the age of multiple testing. By controlling FDR, they enable more discoveries without excessive false positives, powering fields from biology to business analytics. Start incorporating them today—your results will be more reliable and impactful.